Monitoring and Observability on the Fine Line of the WAN
One piece of the stack, whether it's for on-prem, public cloud, multi-cloud, or hybrid cloud, one thing holds true - at some point, there is "something" within your stack on the internet.
And the internet isn't always probable.
In this blog post, you'll learn how to get true monitoring across everything from your environment to the internet with IPM.
Why IPM
Internet Performance Monitoring (IPM) deep dives into everything and anything on the internet that can impact your environment, whether you're on-prem or in the cloud. This is truly important because there are a lot of factors that can impact you and it has nothing to do with what you've done or more importantly, what you can do. For example, if a region is down in the cloud, you can't do anything about that particular region.
With IPM, however, you can at least know what's happening. That way you can plan and scale accordingly.
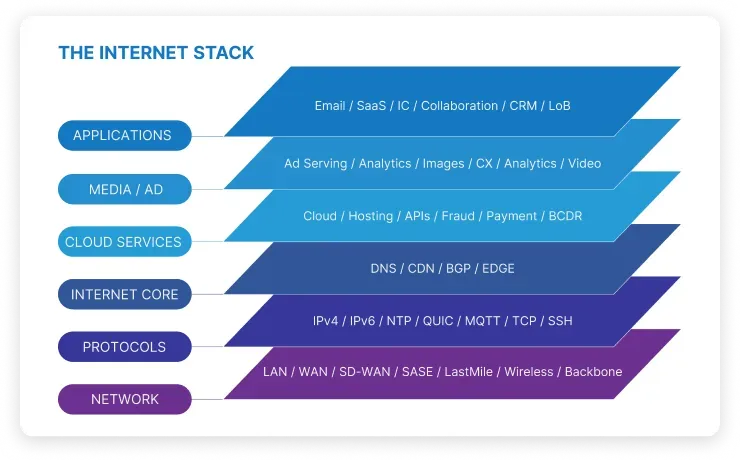
IPM refers to "the internet stack" as it ties into everything from wireless to edge devices to cloud (both private and public) to SaaS and everything in between. From the second an application stack is deployed to when it's running it production, there are a lot of tools and platforms that are in the middle of all of that.
For example, if you're deploying to Azure Kubernetes Service (AKS), there's a lot of various services that go into that within Azure. Outside of the services, you're also at the mercy of the public internet and regions (data centers). With all of the services together, it's now very much an "internet stack".
So, how do you get to IPM status? Enter Catchpoint.
Catchpoint Breakdown
Catchpoint allows you to implement the full monitoring stack for IPM.
Several key aspects of IPM with Catchpoint are:
- Endpoint and BGP monitoring.
- Real user monitoring.
- Internet monitoring.
- Website monitoring and observability.
For any environment and for any organization, performance monitoring and observability is key. Better monitoring means less "finger-pointing" at engineers and other teams. It's the make or break between potential customers trying out your product and hopefully staying or leaving and going to one of your competitors. The goal of Catchpoint is to implement monitoring and observability not just at the internal systems/application layer, but outside of the systems engineers internally manage to truly understand what's occurring across the entire stack.
The overall gist of Catchpoint is, as mentioned in the previous section, IPM. Catchpoint gives you the ability to implement the entire IPM stack. For example - company A is in New York and they're having an issue with the internet because Comcast is down and the reason why that's occurring is because the cloud provider is having an issue. It's all connected in some way, shape, or form and engineers need to know all of that information.
In terms of other tooling and competition - you'll see a few other monitoring and observability tools within this space, but truthfully, there aren't a lot of IPM-related tools.
Implementing IPM
Now that you've learned about IPM and why you'd want to implement Catchpoint, let's dive into how you'd implement a tool/platform like this.
First, you'd start with implementing tests against your resources (VMs, app stacks, clouds, etc.). Catchpoint then uses those tests to see what pieces of the "internet" your resources are using. For example, if you're using a resource that uses Comcast, you'll see that path to Comcast ingested into Catchpoint.
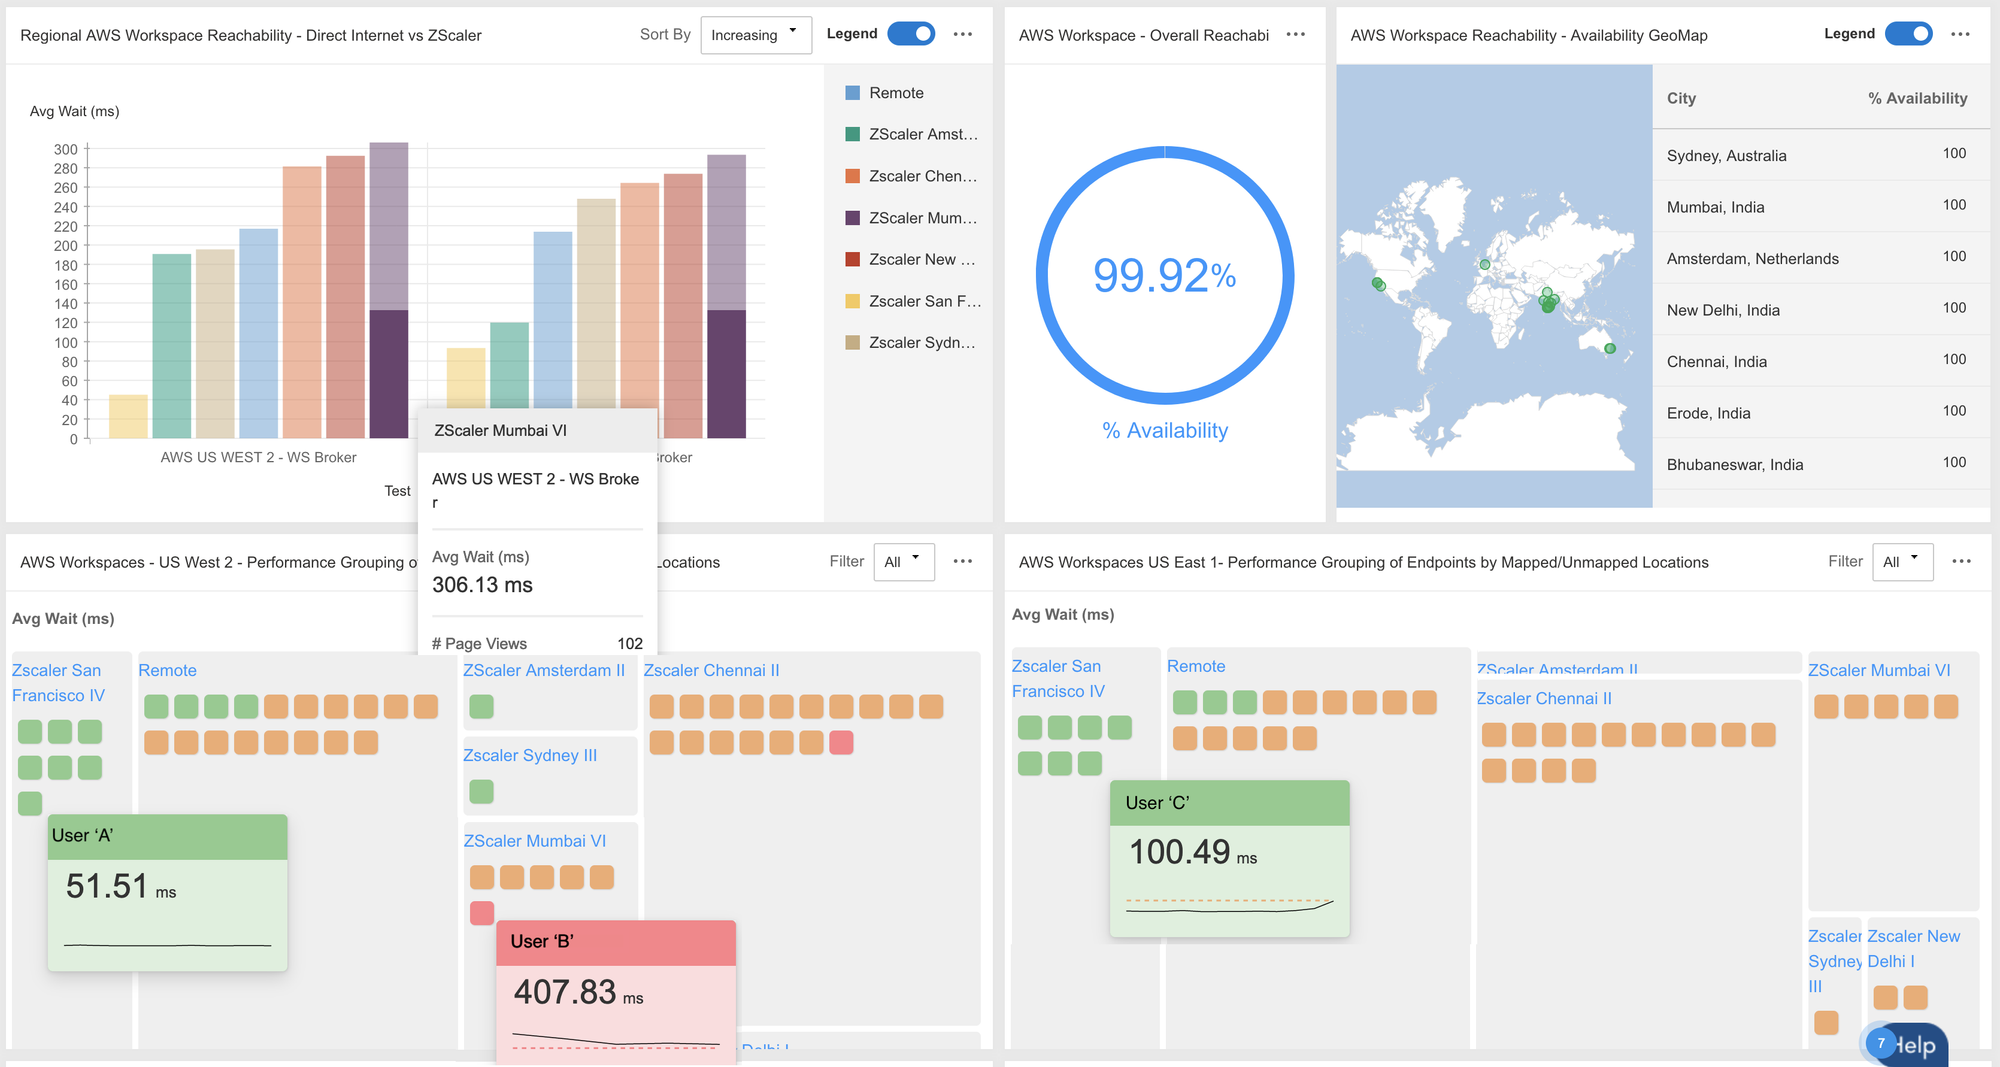
After the connections are implemented, you'll see the resources within the Catchpoint dashboard. You'll then be able to follow the path from where the user reaches out to your application to the problem that's occurring.
From a global perspective to receive the data based on where and what's going wrong, Catchpoint has over 3,000 endpoints.

Comments ()